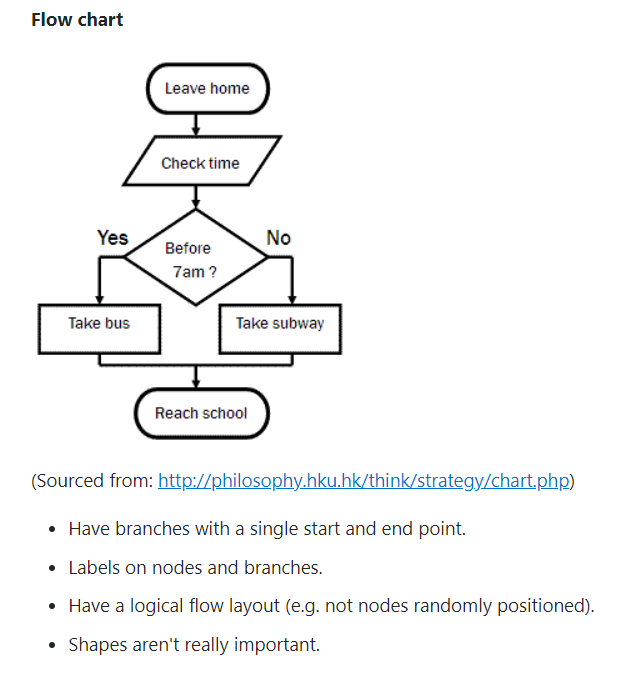
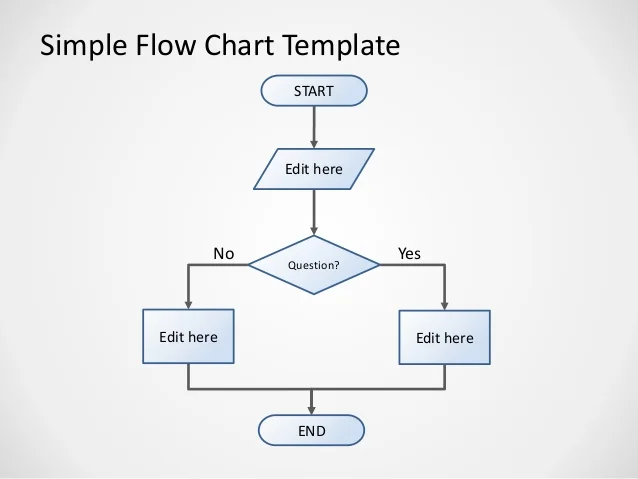
Did it ever think that you needed to show a process in a visual way? Why don’t you try doing this using a flow chart. Here below on the left is a flow chart for a morning routine that most of us need to follow, while on the right there is a template that shows you how the shapes can be used to show whether there is an option (like yes/no). A flow chart always shows a process and has a start and an end.
Why should you use flow charts as a study aid?
This tool’s simplicity makes communicating and showing a process quickly and clearly.
But you can also benefit from the process of creating a flow chart itself, as you build it step by step. You’ll be able to focus on the detail of each step of process.
Building a flow chart is easy!!!
Begin by listing all of the steps of a process in chronological order. Ask questions such as, “What happens in the next step?” or, “Do you need to make a decision before the next step?” or, “What are the options before the next step?”
Put yourself in the shoes of the person who is using the flow chart, possibly for the first time. Better yet, for some subjects and topics you can take a hands-on approach and go through the steps yourself, and think about the practicalities and options at each step. Try it out! It will be worth it!
Let’s recap!!
Elongated circles show the start and end of a process.
Rectangles show instructions or actions to take.
Diamonds highlight that you need to make a decision!
Parallelogram show input or output 🙂
Using Web Apps for building flow charts
You’ll likely start with drawing flow charts by hand, but it’s often more convenient to use a diagramming app to save, amend and share your charts.
Free apps vary from the simple and free, such as draw.io, creately and Pencil Project, to the more complex and paid-for, such as gliffy™, Lucidchart, SmartDraw™, and Visio®.
You might like to watch this video as well or this page here. Good luck 🙂
Tip: Work with one or more study buddies to build different flow charts and exchange them between yourselves.
